Plot object positions
plot_position.RdThe function plots position tibble based on x, y values and potentially extra values from settings. Position is expected to be position tibble, but it may contain extra columns for graphics: target (Logical vector indicating whether object is target or distractor), fill (Character vector with colour names of object interiors.), border (Character vector with colour names of object borders.).
Usage
plot_position(
  position,
  settings = default_settings(),
  targets = NULL,
  background_annotation = NULL,
  foreground_annotation = NULL
)Examples
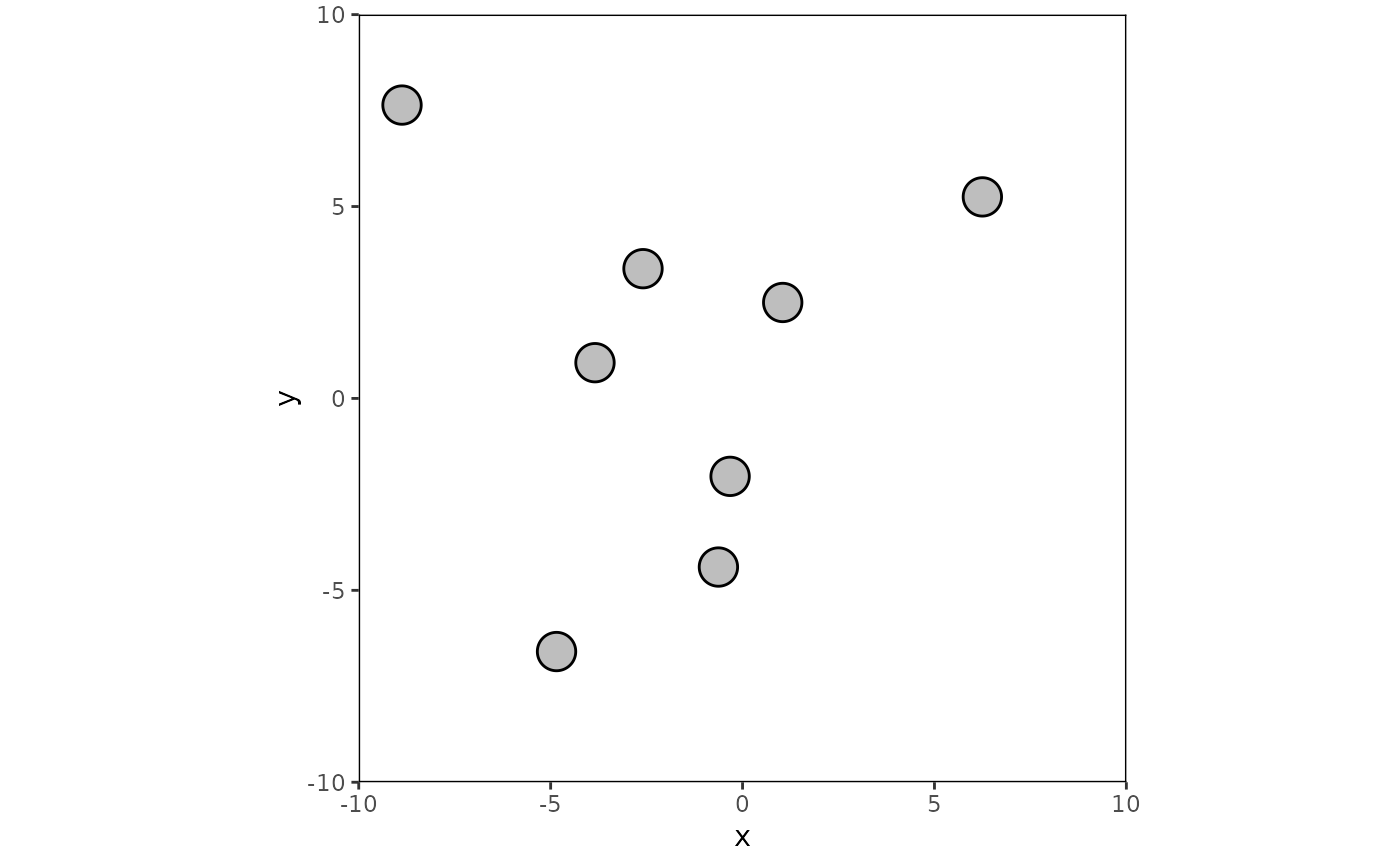
# sample positions with no other requirements
set.seed(100)
pos <- generate_positions_random(8, default_settings())
plot_position(pos, default_settings())
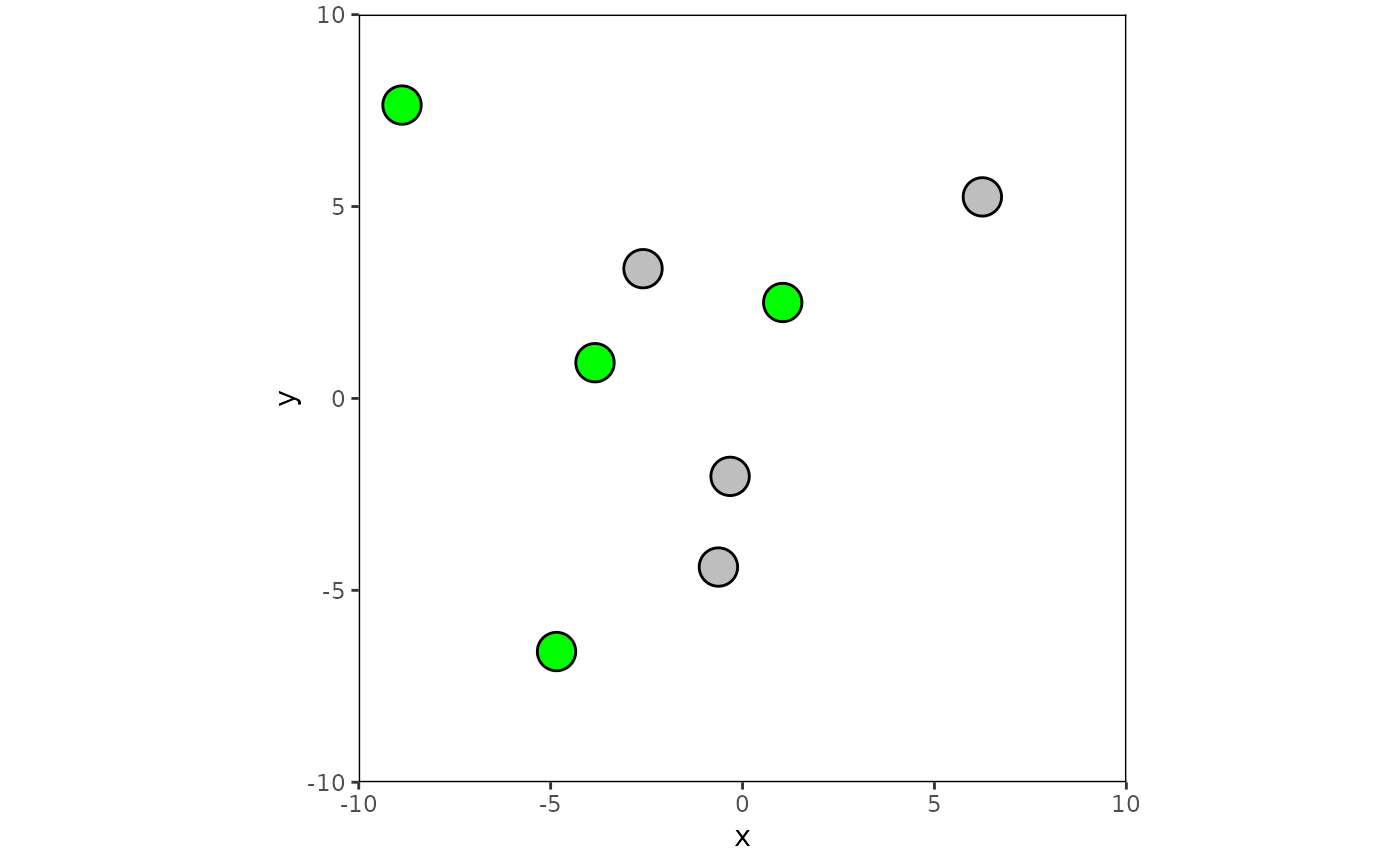
 # first four objects are targets
plot_position(pos, default_settings(), 1:4)
# first four objects are targets
plot_position(pos, default_settings(), 1:4)
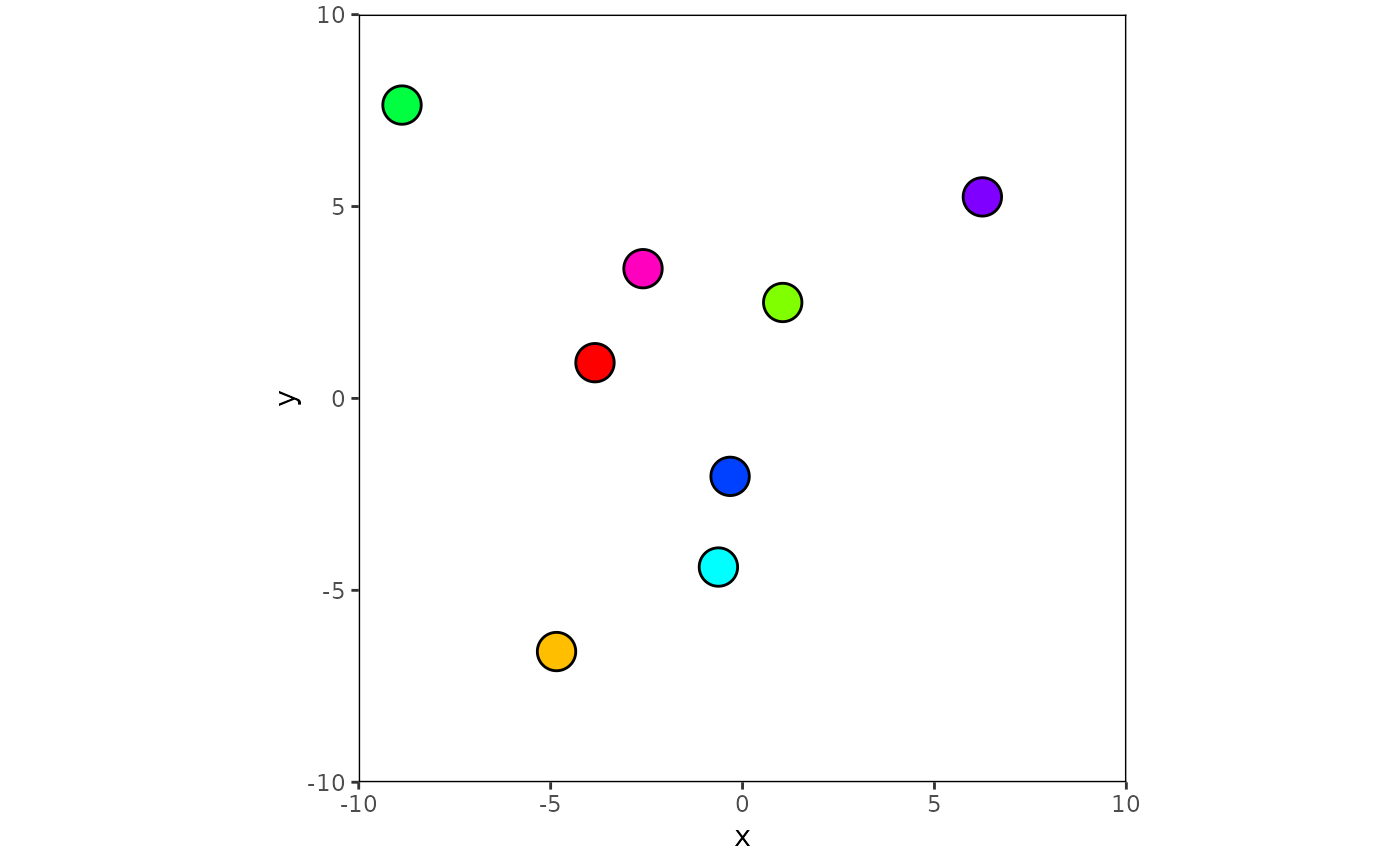
 pos$fill <- rainbow(8)
plot_position(pos, default_settings())
pos$fill <- rainbow(8)
plot_position(pos, default_settings())